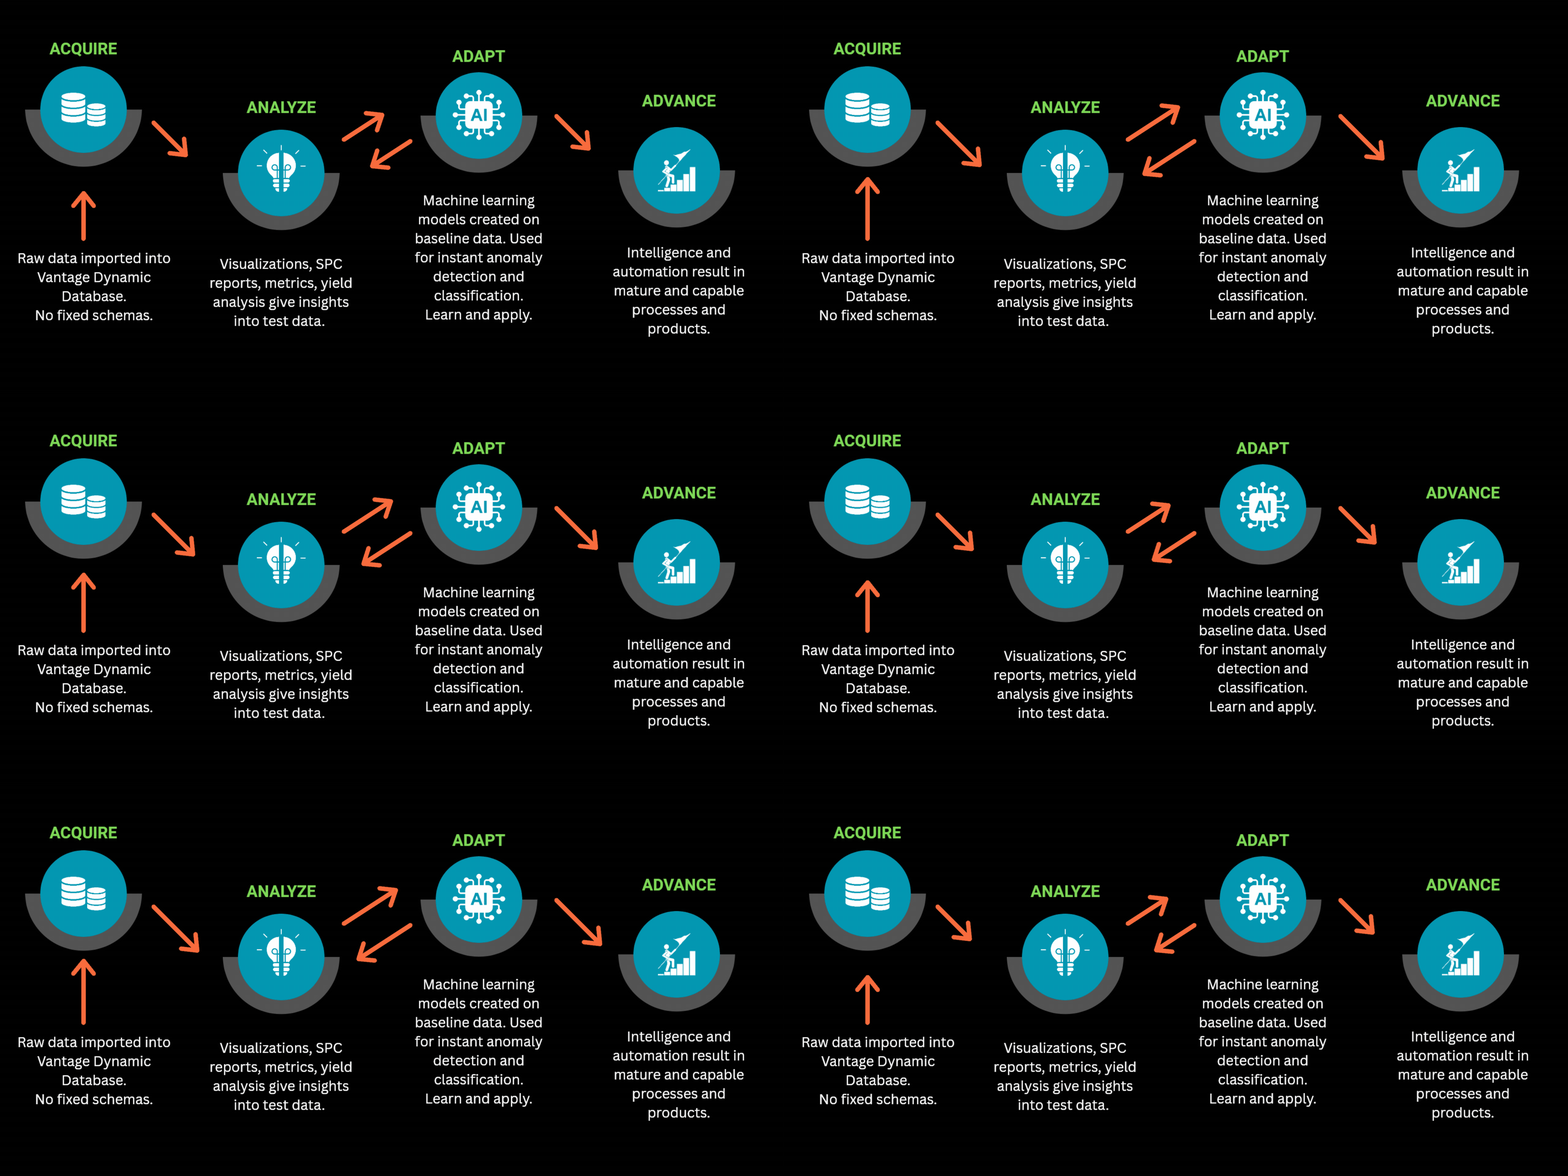
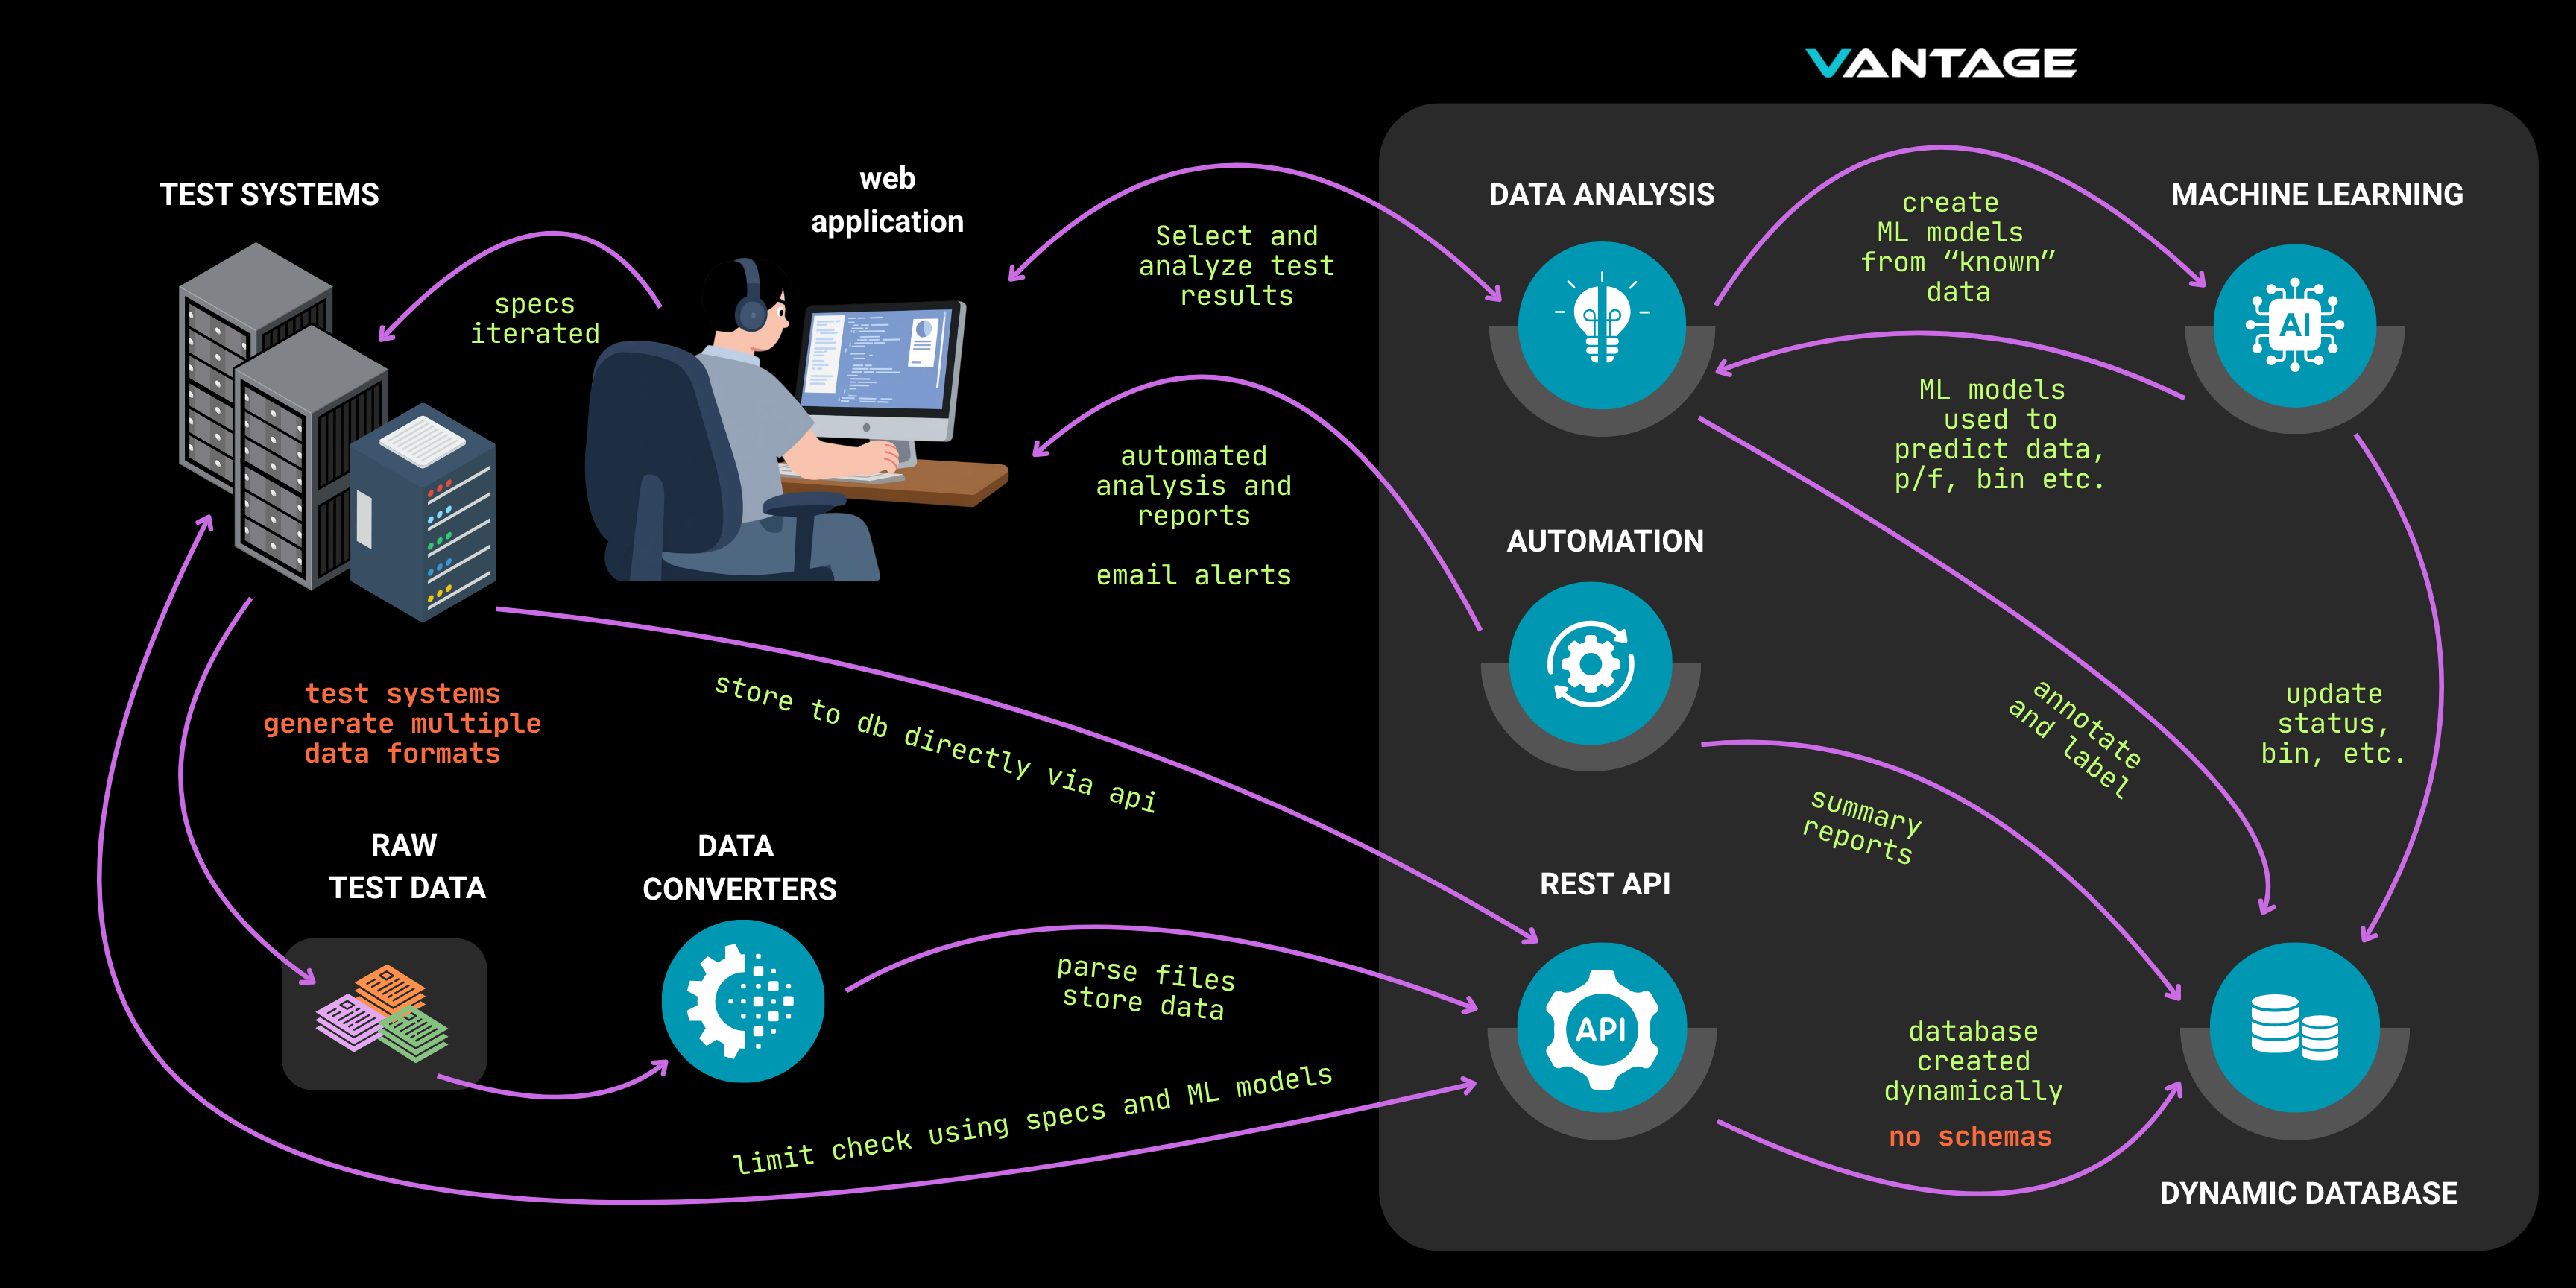
Vantage is an end-to-end platform for data warehousing, analysis, reports, and QA
✓The dynamic database lets you break free from files, share drives, spreadsheets, and scripts.
✓Centralized (more secure) data access across multiple sites and users.
✓Web application for secure, centralized data analysis across multiple sites.
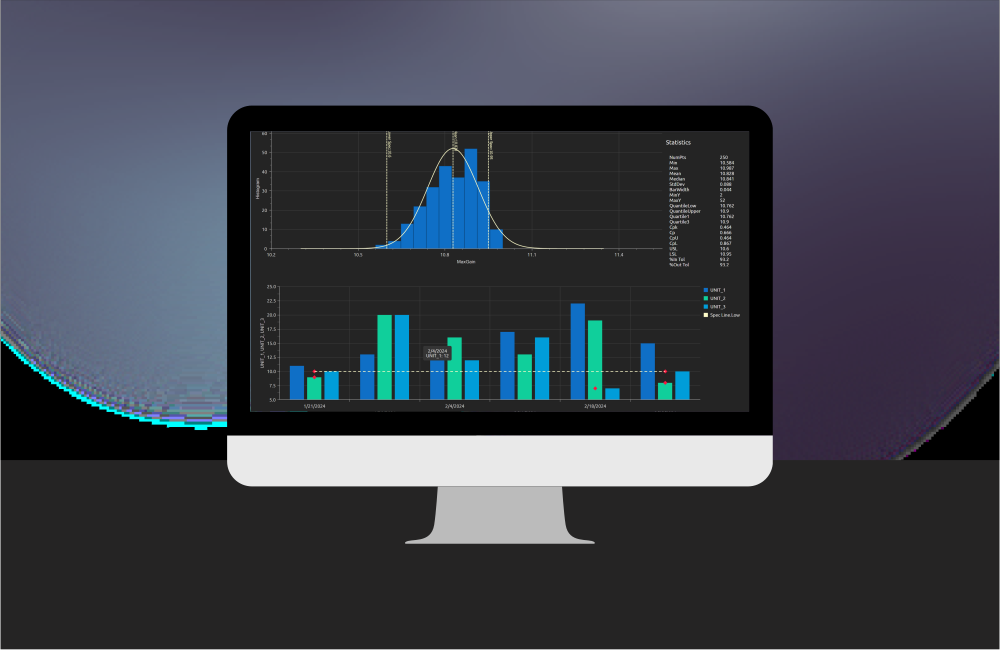
✓Rich visualizations for SPC, compliance reports, and root cause.
✓Limit checking and yield processing with hypothetical yield testing.
✓Machine Learning for deeper correlation and anomaly detection.
✓Automate plots, ML analysis, limit check, and summary reports. Get data and report alerts
✓User customizable with plugins for analysis and custom reports.
Features
Hit Production Goals!
With Vantage you can quickly recover from root cause, optimize resources, and improve production yield.
Prevent product failures, down-time, or inefficiencies in testing from holding you back.
Verify product conformance!
With Vantage, you can automatically create custom compliance summary reports, optimize yield criteria, and get timely insights with a live searchable database.
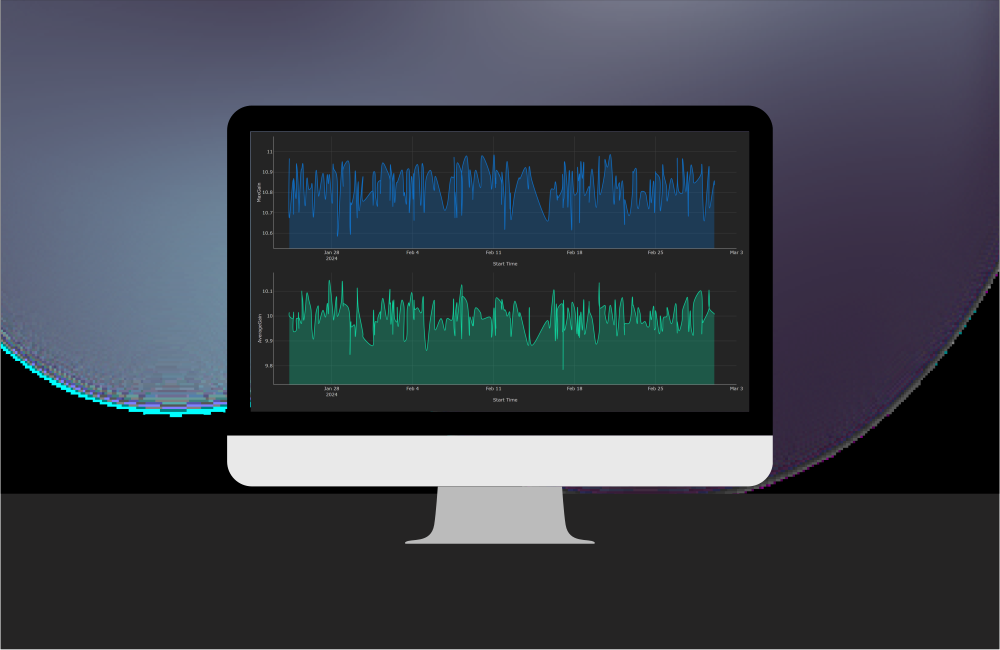
Identify problems with trend, correlation, and SPC plots.
Close Quality gaps!
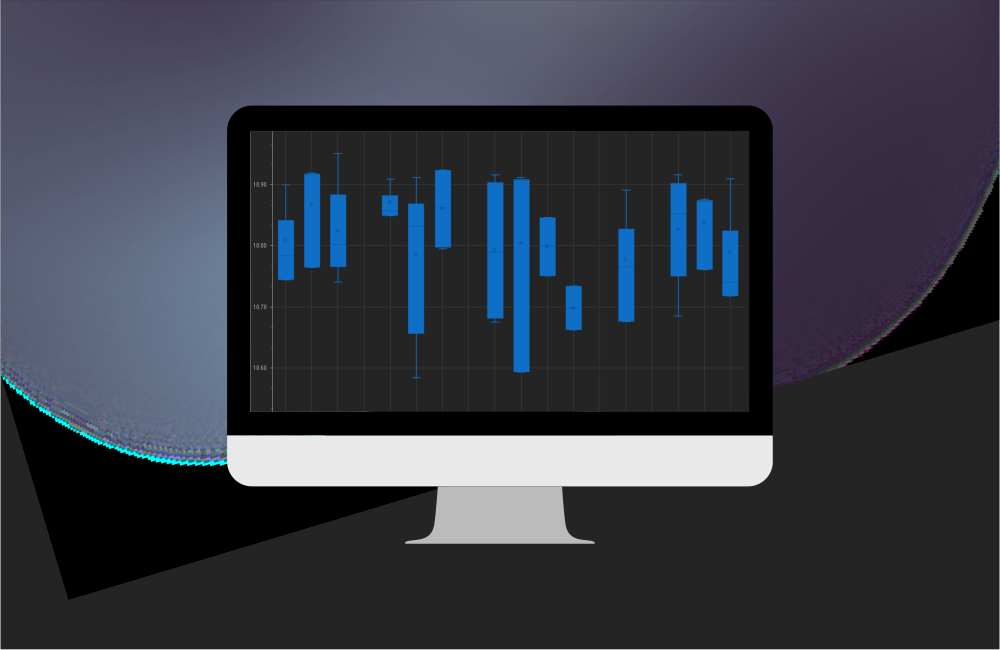
With Vantage, you have live access to manufacturing data and can create and automate built-in SPC reports like Cpk and Box Plots.
Measure and monitor quality indicators without number crunching in spreadsheets
Machine Learning & Regression
Create machine learning models from existing regression algorithms.
Use ML models to automatically flag anomalous data and outliers.
Automated hourly, daily, or weekly reports to notify you of excursions and anomalies.
RF Data Handling
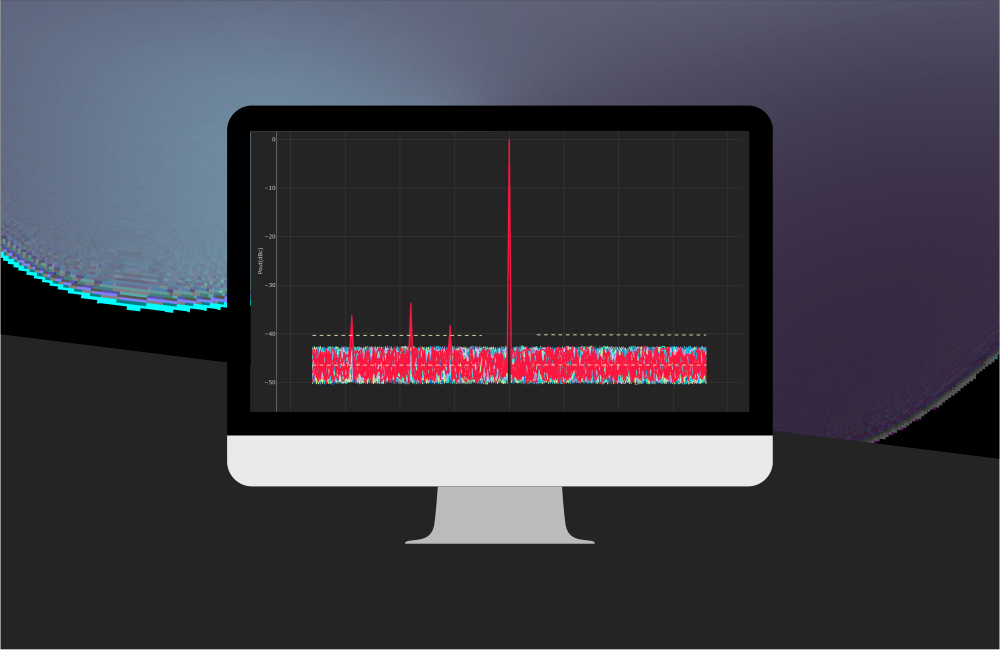
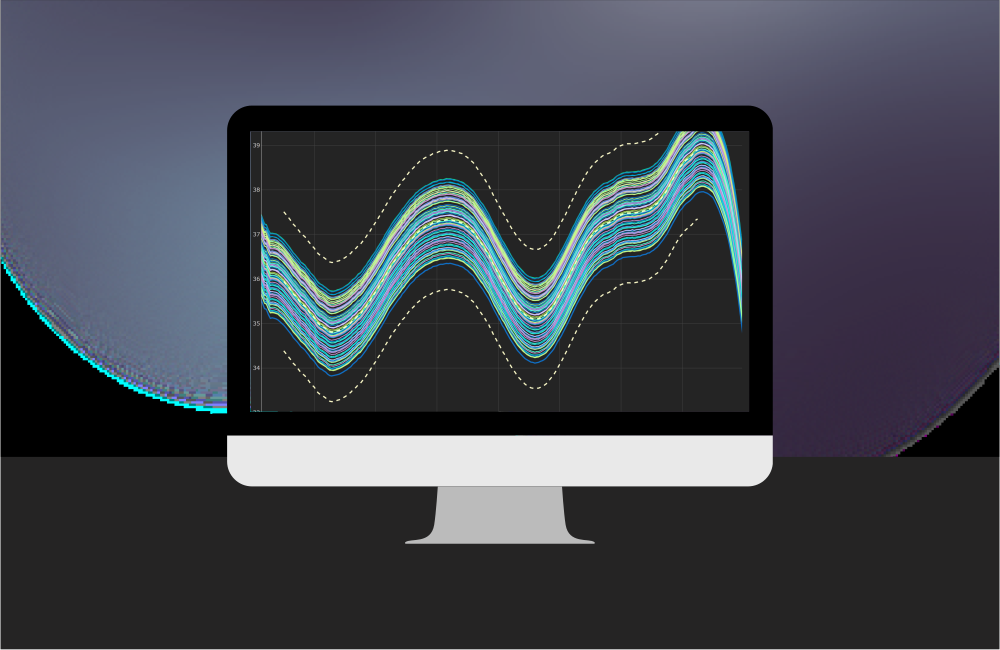
Overlay RF Plot data and evaluate with specification masks and outlier detection algorithms.
Built-in RF math library to calculate VSWR, Bandwidth, Delay and more.
Overlay all your S parameter data in a smith chart to find correlation and detect anomalies!
Find root cause faster!
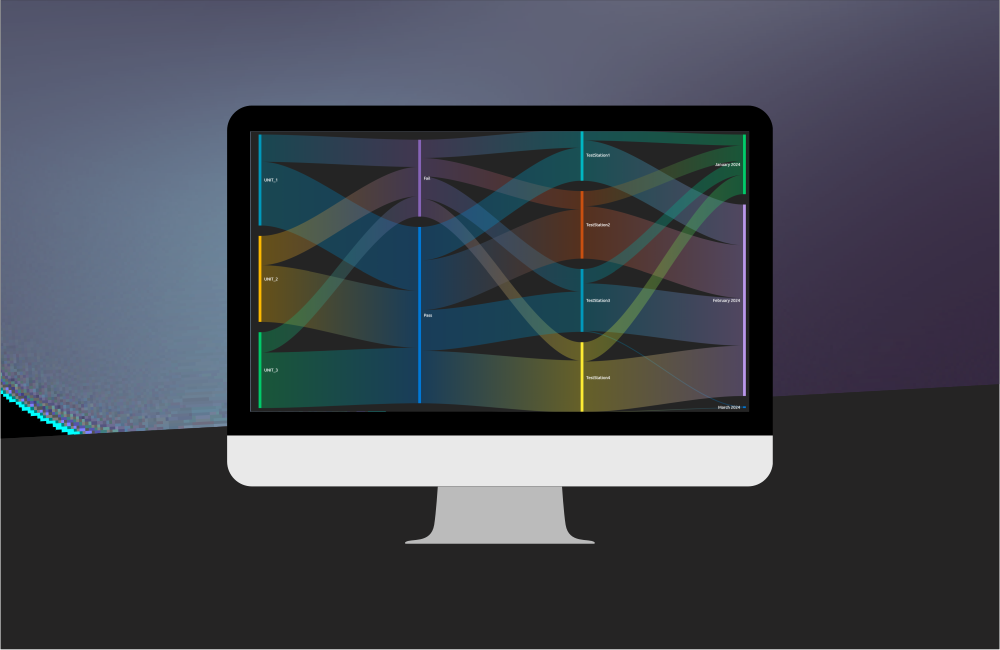
Vantage has rich data visualizations like Sankey diagrams, Treemaps, Heatmaps, pie charts that let you find root cause faster.
View grouping allows you to view plots side-by-side to correlate data across stations, units, or any other data field.
Demos
Result Views
Vantage makes it easy to create data views from query results.
Views are organized into a session that you can save and share with other users in the organization.